
The work I’ve been doing between Claude Cowork and Excel lately has been considerably more involved than what follows. But this example makes the pattern clear - and it captures exactly why the combination saves so much time and frustration.
I had a list of 20 ASX stocks in an Excel file. Two columns: ticker code and company name. I wanted two more: market cap and 12-month return, pulled from most recent data.
Old answer: open a browser, visit marketindex.com.au twenty times, copy-paste twenty market caps and twenty return figures. Forty manual data entries. Maybe twenty minutes of tedious tab-switching if you’re fast. More likely half an hour once you’ve lost your place twice and fat-fingered a number.
There’s a fancier old answer too: use an Excel VLOOKUP or XLOOKUP that references a second spreadsheet you’ve manually downloaded from somewhere, hope the column names line up, debug the #REF errors, realise the downloaded file uses a different ticker format and spend ten minutes on a SUBSTITUTE formula. This is the kind of work that makes you question your life choices.
If VLOOKUP means nothing to you don’t worry: it’s an Excel formula for cross-referencing two spreadsheets, matching rows in one table against values in another. The good news is you never need to know what VLOOKUP is - Claude will do it for you.
Neither answer is worth the effort for a twenty-stock list. Both answers become genuinely painful at a hundred stocks.
So I asked Claude Cowork to do it instead. The whole thing took three minutes and forty-one seconds.
What actually happened
The task was simple to describe: take this Excel file and add columns for Market Cap and Last 12 Months % for each stock, sourcing the data from marketindex.com.au.
Claude opened a browser tab, navigated to the first stock page, extracted the two data points, navigated to the next page, extracted again - twenty times in sequence. Then it wrote all forty values back into the workbook with conditional formatting: green for positive returns, red for negative.
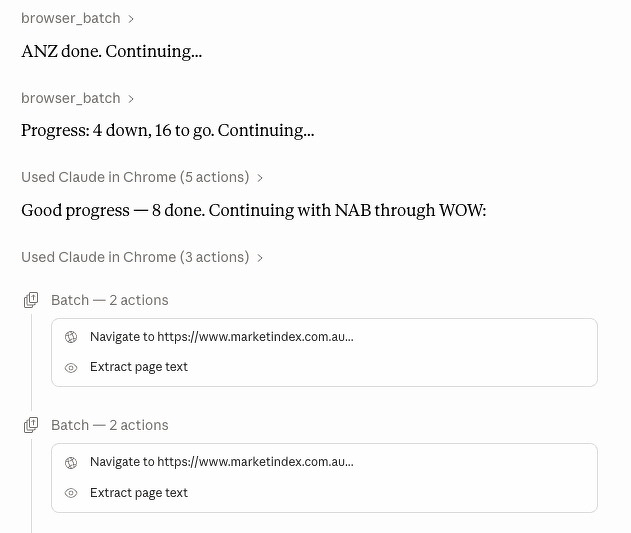
No manual browsing. No downloaded CSV. No formula archaeology. A file went in, a richer file came out.
The thing worth noticing is what I didn’t have to specify. I didn’t have to tell Claude which part of the page to look at. I didn’t have to describe the HTML structure of marketindex.com.au or point it at specific CSS selectors. I described the outcome I wanted, and it worked out the mechanics.
Why VLOOKUP doesn’t cut it here
VLOOKUP is a matching function. It connects two tables that already exist. The fundamental limitation is that someone - you, usually - has to create both tables first.
Getting live data into Excel has always required either a paid data feed, a web query that fights with authentication and page structure, or the old-fashioned copy-paste grind. The “Power Query from Web” option in Excel can work, but it requires the source page to have a clean, stable table structure. Most financial data pages don’t. They’re rendered dynamically by JavaScript, which means the data isn’t in the HTML when Excel goes looking for it.
Claude in Chrome navigates pages the way a human does - it waits for JavaScript to render, reads what’s actually on screen, and extracts what it needs. That’s a fundamentally different capability than anything built into Excel.
The other thing VLOOKUP can’t do is generalise. You can teach it to match a ticker code against a downloaded dataset. You can’t teach it to visit a website, read a page, decide which numbers are the ones you want, and write them into a different format. That requires judgment, not a formula.
The pattern is the point
What we did with ASX stocks is a template for a very common workflow problem: you have a structured list of things (stocks, customers, properties, products, competitors) and you want to enrich it with data from somewhere on the web.
The traditional options are: do it manually, hire someone to do it manually, pay for a data API that may or may not cover your exact use case, or build a web scraper (which requires code, maintenance, and breaks whenever the source site redesigns its pages).
Claude Cowork adds a fourth option: describe what you want in plain English, point it at the source, and get a populated file back in minutes.
This isn’t magic. It’s a browser that can read and an agent that can act on what it finds. What’s changed is that both capabilities are now packaged together and accessible without writing a single line of Python.
What the data actually showed
The exercise was also a useful reminder that the ASX top 20 is not a monolith right now.
RIO had the best 12-month return in the list at +63.4%, followed by BHP at +56.2% and WDS at +43.4%. The materials sector had a strong year.
CSL was once one of the few ASX 20 growth stocks. That was until Emperor Trump returned. RFK Jr’s appointment as HHS Secretary sent US flu vaccination rates off a cliff, de-scoped government contracts with CSL’s Seqirus vaccines division and killed the planned Seqirus demerger that would have unlocked real shareholder value. The plasma business is fine. The question is whether American vaccine scepticism is a four-year weather event or a permanent rerating of anything with a syringe in its product portfolio.
BHP remains the largest company in Australia by market cap at $307 billion - roughly the same size as CBA’s $275 billion. The two biggest companies in the country are a miner and a bank. That tells you something about the Australian economy that no amount of commentary about “the innovation economy” quite explains away.
The honest limitation
This approach works beautifully when the data is available on a public web page and the structure is consistent across all the pages you’re visiting. Marketindex.com.au has a standardised layout - every stock page has Market Cap and 1 Year % in the same location. That consistency is what makes the task tractable.
If you needed data from a site with login requirements, inconsistent page structures, or aggressive bot detection, it would be harder. Not impossible, but harder.
It’s also worth being clear about what this is not: it’s not a live data connection. The file you get back is a snapshot of the data at the time Claude ran the task. If you want a file that updates every morning, you’d set up a scheduled task to run the same prompt on a cadence. That’s a different capability and a five-minute setup.
For a one-off enrichment of a static list - which describes the majority of these kinds of data tasks - the approach works exactly as described.
The actual shift
The bottleneck in this kind of work used to be technical. Could you write a scraper? Did you have API access? Could you build the VLOOKUP correctly? Those questions filtered out anyone who couldn’t code or couldn’t afford data subscriptions.
The bottleneck now is imagination. Can you describe what you want? Can you think clearly about what data would make your list more useful? Can you identify the source that has it?
Twenty stocks. Two columns. Four minutes. The limiting factor was knowing what to ask for.
Source: marketindex.com.au | Data as at 26 May 2026